

If you can’t measure it, you can’t improve it. – Peter Drucker
A few years ago I was introduced to a growing subculture in the U.S. that was really interested in numerically measuring a variety of aspects of their lives like steps, sleep, environmental conditions around where they lived, etc. and attempted to draw correlations from this data to improve some aspect of their lives. This was before the current explosion of fitness devices and collecting this data was a lot more difficult, and yet these individuals went through enormous effort often wearing clunky self-made devices to get access to the numbers they were looking for. The behavior seemed, at least by conventional definitions, not normal.
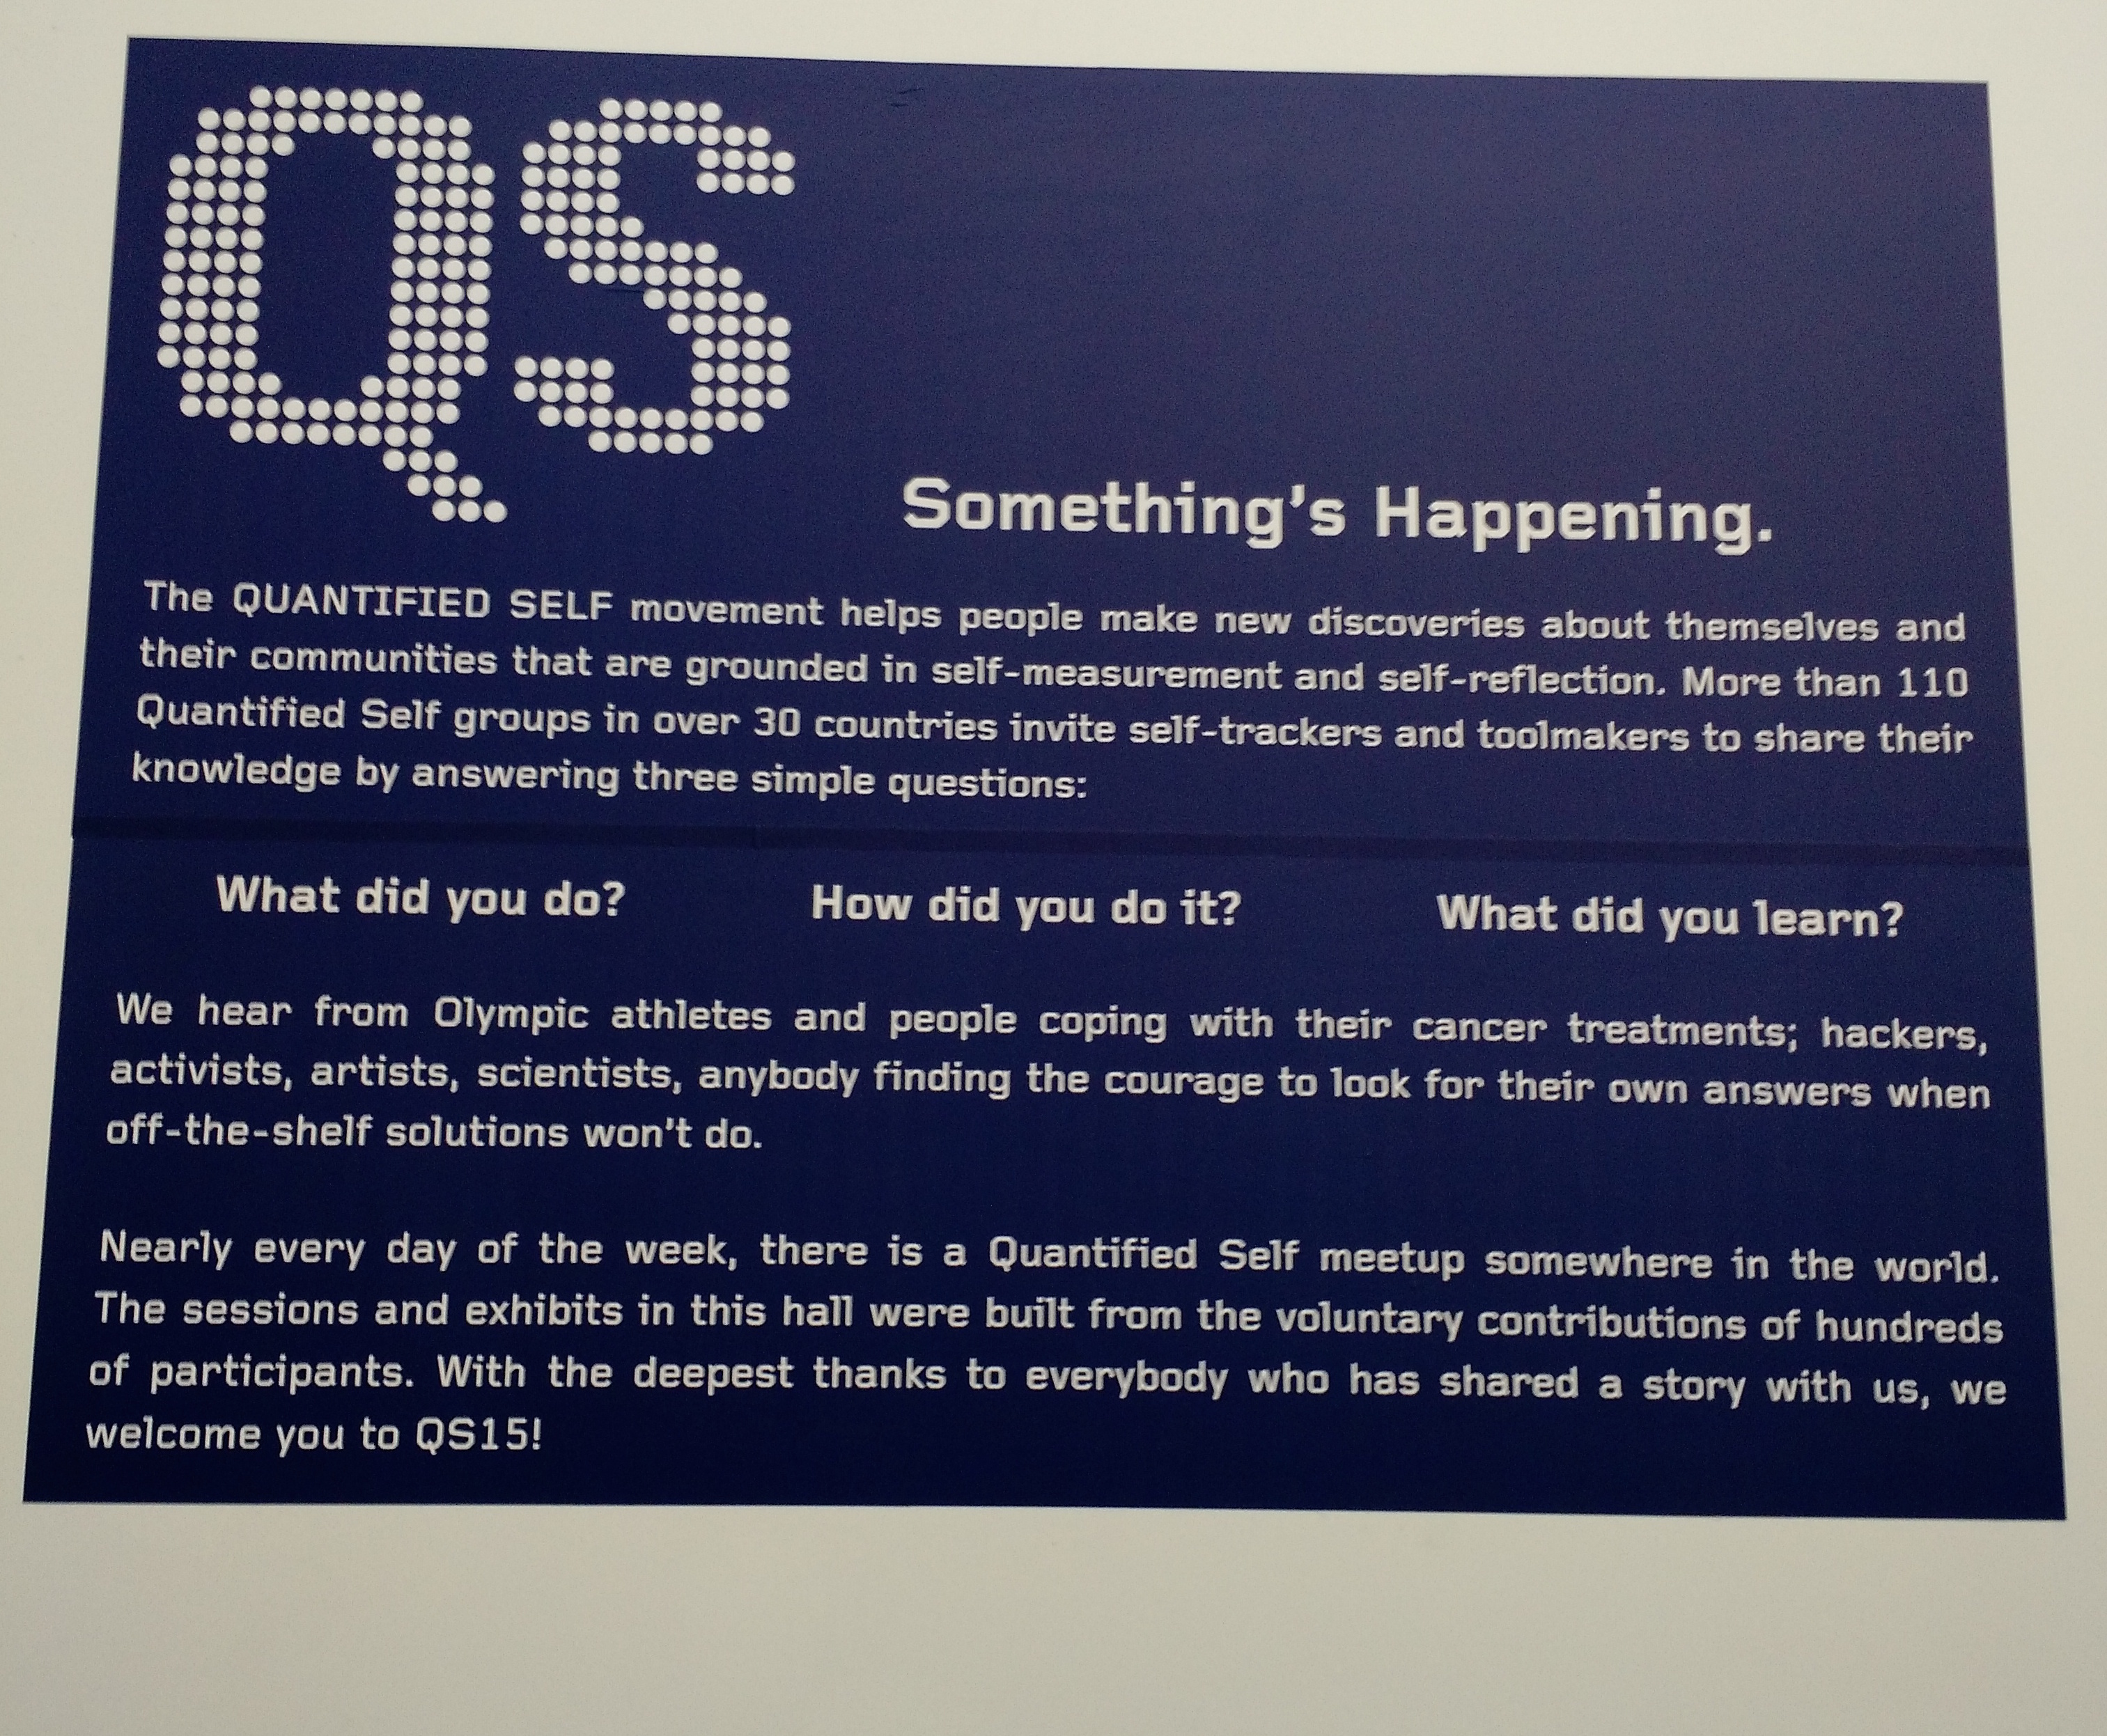
Today, at least a part of this behavior has seeped into conventional user behavior with the rise of measuring devices like Fitbit, smart watches etc and the constant running of ads emphasizing the importance of people tracking their own fitness. But the QS community continues to break new ground in identifying interesting metrics about themselves and finding creative ways to collect them.
A couple of weeks ago, the QS community had their annual conference in San Francisco and I was fortunate to be able to attend it as Comcast Labs, the group I work for, was one of the primary sponsors.
Motivations
The QS community is an interesting group of people that come together around their common interest of measuring personal data. I had assumed that it would be predominantly be full of technologists or statisticians, but I met people from a variety of backgrounds from artists to models to fitness instructors.
I feel I met 3 types of people there:
- People doing it for pure curiosity, like measuring time spent on couches or watching TV, cataloging their travels or seeing if chat history could show when they fell in love with their now significant other.
- People who were trying to deal with real or potential health issues like building apps to collect data to quantify effects of both disease and medication on their bodies
- People who were using their their own data for artistic interpretations or visualization
The Data:
What was interesting was the sheer number of data points people were tracking. A lot of this data used to require medical grade equipment to measure but now can be measured with fair accuracy using off the shelf devices.
These included
- Heart Rate Variability
- EDA: electrodermal activity, also known as EDR or GSR, galvanic skin response
- BMI
- Blood pressure
- Fat percentage
- Macro Nutrients intake
- Sugar intake
- Hydration
- Resting Metabolic Rate
- Resting Heart Rate
- Anaerobic threshold:
- VO2Max
- METs
- EEG
- Breathing patterns
Not all metrics were biological. There were also examples of people tracking environmental and social metrics that could influence their lives like:
- Electric and magnetic fields in their environment
- Expenses
- Email volume and how it related to their stress levels
Questions and Answers
Getting data is only one part of the equation. The real challenge is to correlate this data to draw insights. There were a number of talks around people drawing such correlations which were interesting cause a few missed that old adage about correlation not being causation (Did you hear the joke about data proving pirates causing global warming? Cause if you plot the rise of piracy and global temperatures on a graph, they correlate pretty closely). The other challenging aspect is the whole Heisenberg Principle about the very act of measuring something changing what you are measuring.
Even so, the speakers at the event had some really interesting talks on a trying to answer a lot of questions via data, such as:
- How does exercise affect metrics like blood pressure or mood?
- How do different diets influence mood, health or different ailments?
- How does zapping your head with controlled electric current affect your brain?
- How does stress affect heart rate variability?
- How much does it cost to eat healthy?
- How happens to your expenses if you don’t have a place to live for a year?
You can see their entire lineup of talks here.
Most of the community uses Google spreadsheets to analyze their data, though there was also a talk by a developer at Tableau software about how he used that to analyze his data. But the community is small enough that right now there aren’t enough general purpose statistics oriented tools built for them. At this point just getting data in a non proprietary format like CSV is a challenge (most fitness related services like Fitbit, Google Fit or HealthKit offer their data via APIs but only a fraction of the audience here were software engineers). Other software tools like Beeminder, Zenobase, Gyroscope, Compass RescueTime were also interesting to see. New wearables like Spire for tracking breathing patterns also piqued my interest but having acquired one, I feel like a second wearable is just one (heh, maybe even two) too many.

In conclusion
The QS conference was quite an experience, specially since I wasn’t that aware of all the stuff happening there and everything felt new. While a lot of it felt a little “out there”, it was the same feeling I got 3 years ago when I first heard about these guys tracking their steps and hours of sleep. It’ll be interesting to see how much of this data measurement becomes commonplace in the coming years.

2 thoughts on “Notes from the 2015 Quantified Self Conference”